CREATIVE AND VISUAL
INFOGRAPHICS DESIGN
Here you will find the following important information for your company:

Graphic design applied to computer graphics is one of the star services I offer, both to companies, government institutions and public agencies, schools and universities, as well as any freelance professional or business.
After more than 28 years of experience in visual graphic design and communication creativity, I am pleased to design this kind of infographic projects for my clients.
I take for granted that you already know, nowadays, what an infographic is and what it is for. Anyway, I’m sure you’ll find below even more reasons to see essential the use of computer graphics nowadays (online + offline).
1. History of the infography
Infographics have always existed.
Graphic designers have created them for many uses and purposes.
I even remember infographic designs that were directly illustrations done by a professional, hired externally from the design studio. Unique specimens made with watercolors, airbrush and brushes loaded with brightly colored anilines.
That was 30 years ago!
There is a lot to tell about the beginnings of infographics.
From the beginnings of humanity and cave paintings, through Leonardo Da Vinci … they are part of an endless list of creations that can be considered infographic designs.

One of the impressive works, and no less intriguing, is undoubtedly the Voynich Manuscript. I consider mainly infographics most of its pages, full of drawings, illustrations and diagrams.
Make sure to read carefully about this mysterious document.
2. What is an infographic?
Infographics is a very powerful visual tool.
Concepts and ideas for which a text, in some cases extremely long, would be needed can be transmitted quickly, clearly and concretely.
The idea is to arrive at an infographic design with the minimum possible text. With the use of super-explicit graphics that clearly expose the necessary contents, we can shorten the time it takes our audience to grasp the message.
Computer graphics can be used to:
- Present summaries, data, statistics and results.
- Show processes with their different phases, or steps to follow.
- Inform about any activity, schedules, prices, themes, places, maps, locations … all the practical information that may be required.
Todo ello aplicable a cualquier sector industrial, producto, servicio… Instituciones y organismos oficiales.
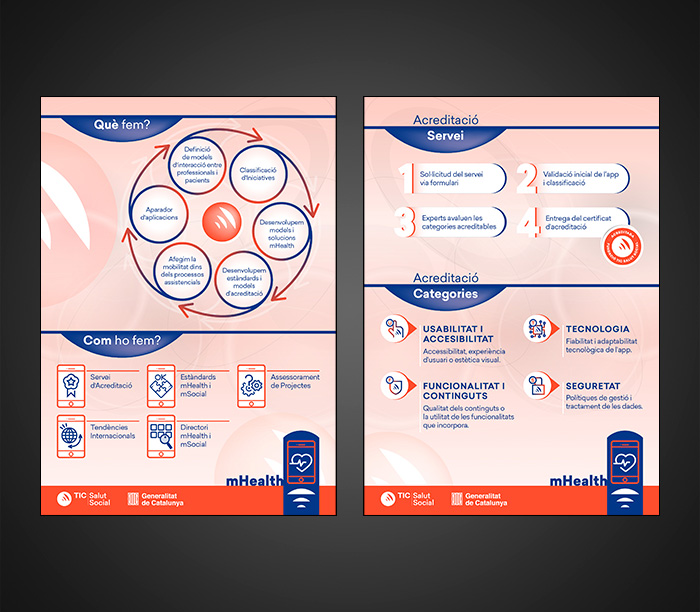
All this applies to any industrial sector, product, services … Institutions and official departments. I have already designed different infographic projects for TIC Salut Social, “Generalitat de Catalunya” or Barcelona City Council.
3. Why are they so useful today?
The popularisation of computer graphics and their exponential increase has come about as a result of their regular use of social networks.
A computer graphics is very useful in Facebook walls, share on Twitter. They are great for presenting professional services or products on LinkedIn business profiles.
One of the important factors for their proliferation is the fact that, nowadays, there are many more professions dedicated to digital sectors. Twenty-five years ago, the needs were very different, as were the channels of communication.
Now we say it all, we sell it, we express it… digitally. We have less time to capture the information and content that interests us. We read more quickly and diagonally. We have to make our time profitable.
Computer graphics help us to achieve all these milestones within our “current digital society”. They are part of the most effective marketing tools and information systems available today.
4. How can an infographic help your company?
I recommend you to order a quality infographic from a graphic designer, if you need to cover the following:
- Explain extensive textual content, obtaining visual compositions that are quick to interpret at a glance.
- Present, sell or explain complex messages in an effective and direct way.
- Reach an end user in a short time and keep them engaged for longer.
Computer graphics are a great tool. Great tools to disseminate content both in print and digital. Reaching more people through social networks or web media, e-mail…
5. The relationship between infographics and company presentations
Many companies contact me for the design of visual, communicative, personalized presentations…
They ask me the difference between computer graphics and presentations themselves. The two can always complement each other. I have designed presentations with and without computer graphics, as well as computer graphics that were not business presentations.
In the world of education, in the medical sector, technology, industry… until now images have coexisted with computer graphics. Schemes, cheeses, statistics bars, pictograms, arrows, icons… have always been used at an infographic level, especially in the famous and well-known Power Point. Yes indeed, the headache of every graphic designer, because of its aesthetic limitation, little versatility and this retro-cut aspect that PPT presentations ended up taking, almost by accident.
Luckily, things have changed a lot! And now we have tools with endless potential like Apple Keynote.
I’m sure you’ll also be interested in my section on corporate presentation design.
6. How do I develop infographic designs?
Today, the availability of stock illustrations and other elements gives a much more modern shade to infographic compositions.
It is true, they do facilitate the work in some way. But let’s not fool ourselves, this factor has also triggered the fact that everyone thinks they can “design” or assemble an infographic.
Let’s not forget that no one can do this job better than a professional graphic designer.
The good compensation of the graphic elements, the communication of ideas, in many occasions, complex to explain, the conceptualization of “abstract” information, the optical counterweights… have to be treated with great care and professionalism.
From a technical point of view, the design of an infographic that has to be pictographic and quite linear will be done in Adobe Illustrator.
On the contrary, a design that has to combine images and other elements not only pictographic, I will develop it with Adobe InDesign.
Logically, in computer graphics designs where you have to follow guidelines marked by a powerful corporate image (as happens with institutions or public agencies) I am always very faithful to the bases.
There are many cases on the net, but I like especially this one of the Generalitat de Catalunya – Identitat Corporativa.
7. Shall we get started with your infographic compo?
Having said all the previous points, if in your company you need to mix short texts, with images, illustrations, graphics and several contents, in a tremendously visual composition, to communicate in a simple and very understanding way… You already know that your next business bet has to be the design of a computer graphics.
Whether it’s for a company presentation, a catalogue design, a poster… computer graphics offer endless information possibilities.
CONTACT ME today to impact your audience.
I will be happy to help you and your company achieve your planned communication and information objectives.
With a 100% personalized infographic, designed exclusively for you (no pre-designed templates), we will transmit all the contents effectively and resolutely.
Go on! Explain to me what you want to communicate effectively with an infographic.
VISUAL AND COMMUNICATION INFOGRAPHICS
COMPUTER GRAPHICS EXAMPLES


